How cancer impacts your body, your health, your emotions, your relationships, your plans for the future—everything that comes with a diagnosis impacts your life in unique ways. At City of Hope, your team and care plan take those factors into account, providing you with personalized care tailored to your diagnosis, hopes and goals.
That’s our difference: comprehensive, personalized care delivered by cancer experts with access to today’s evolving technology, working collaboratively, coast to coast, in real time.
GET THE EXPERTISE YOU DESERVE
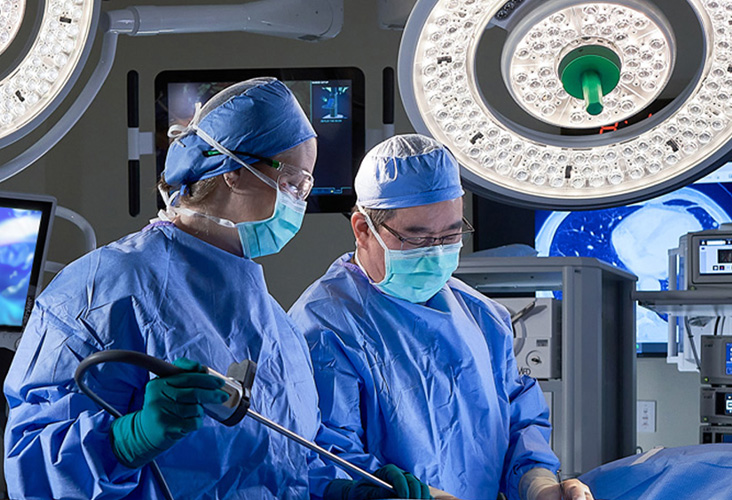
City of Hope's cancer care experts have extensive experience diagnosing and treating early-stage and advanced-stage cancers, in addition to rare and complex cancers. Our oncology team uses a wide range of standard-of-care and innovative technologies and treatments, including precision medicine breakthroughs in immunotherapy and targeted therapy drugs, to treat your specific cancer type, while also offering qualified patients access to investigational research on potential new treatment approaches.
Being surrounded by a team of cancer experts allows you to explore cancer treatment options sooner. The City of Hope team includes board-certified specialists with advanced training and expertise in specific cancers—from breast, lung, prostate and colorectal cancers to melanoma and leukemia—as well as the wide range of treatment options available to fight them.
At City of Hope, a world leader in cancer research, treatment and prevention, we help qualified cancer patients get access to new and innovative treatment options. The research team at City of Hope identifies and studies new and emerging treatment options that are supported by scientific and investigational research. City of Hope’s investigational research programs may offer patients early access to treatment options that would otherwise be unavailable to them.
At City of Hope, we use precision medicine tools to identify what makes a particular cancer behave the way it does. As precision medicine research continues to rapidly evolve, our oncology team is prepared to make a cancer care plan tailored to your genetic makeup, utilizing advancements in pharmacogenomics, analytics, biomarker testing and artificial intelligence.
The care team may recommend targeted therapy drugs to treat your cancer based on advanced genomic testing results. These therapies are designed to identify features unique to cancer cells and target specific mutations or proteins that may be fueling the cancer’s growth.
The hospitals in our comprehensive cancer care network are accredited and certified by a number of renowned professional health care organizations for delivering high-quality care and exceeding patient safety standards.
SO YOU CAN FOCUS ON YOU
Cancer is a complex disease, requiring multiple appointments, medications and treatments, as well as support and follow-up care. At City of Hope, our coordinated care team is committed to helping you handle these logistics, so you don’t have to do it alone. That’s why we developed a comprehensive care model that assigns a coordinator, or team of coordinators, to your care team, to ensure that your medical needs are met in a seamless fashion.
Your care manager at City of Hope is a nurse with cancer care expertise who serves as the point of contact for most aspects of your treatment journey. Whether that involves coordinating doctor visits and treatment appointments, refilling prescriptions or explaining the process, your care manager helps keep you informed every step of the way.
As liaisons between you and your care team, your care manager is the common thread holding the different aspects of your cancer treatment journey together, so you can focus on you.
Finding a cancer treatment center and care team that meets your goals, expectations and needs is a necessity. At City of Hope, we understand how essential the decision-making process is, and the anxiety that may accompany it. That’s why we prioritize treatment that is as convenient, affordable and stress-free as possible. Below are just a few of the benefits that come with being a City of Hope patient.
ONE CALL IS ALL IT TAKES
SUPPORTING YOU THROUGH YOUR SURVIVORSHIP AND BEYOND

Miriam T.
Breast Cancer
Our team works with you throughout your cancer treatment journey to develop ways to maintain and improve your health. After you complete your primary treatment, you’ll meet your survivorship team. Together, they’ll offer strategies to prevent and detect new or recurrent cancers and interventions for late effects resulting from cancer and/or treatments. They'll also continue to coordinate communication between specialists and your primary care doctor and provide guidance about living a healthy lifestyle after cancer. Whether you’re at one of our hospitals or at home in between visits, we’re here to help. Members of your care team are only a phone call away.
A SECOND OPINION IS YOUR FIRST PRIORITY
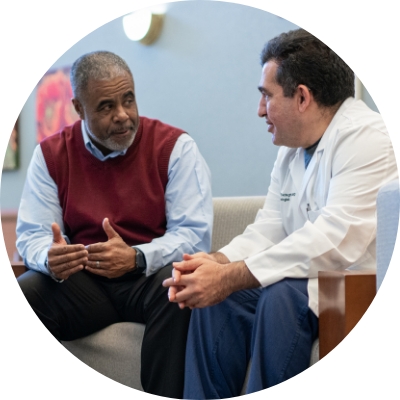
Keith R.
Prostate Cancer
Being diagnosed with a serious illness is life-changing, and your next steps are critical in achieving the best possible outcome. At City of Hope, we believe you need to clearly understand your options in order to join your care team in making the decisions that are right for you.
You can seek a second opinion even after you’ve started treatment.
The world-renowned team at City of Hope will make sure your diagnosis was correct, and give you a thorough understanding of the latest advances and therapies available, providing you peace of mind about your treatment plan. We take the opportunity to listen, hear your concerns and answer your questions. Our expertise comes from treating cancer—every stage, every day. Call us now to schedule your second opinion appointment.
HEAR FROM OUR PATIENTS, IN THEIR OWN WORDS
SCHEDULE YOUR SECOND OPINION APPOINTMENT
We strive to make becoming at patient at City of Hope as easy and stress free as possible. Get to know what your experience will be like as a City of Hope patient, step by step.
What to expect when you become a patient, step-by-stepA second opinion may point to a different cancer type, and a review of your genetic profile through advanced genomic testing may uncover a more advanced treatment option not previously considered, or help to confirm your current diagnosis and treatment plan.
About a second opinion from City of HopeThe modern era of cancer treatment is constantly evolving, with new breakthroughs and discoveries changing the course of cancer care at a rapid pace. Our cancer experts treat cancer with a wide range of standard of care and innovative techniques and approaches, including high tech diagnostic tools, targeted radiation therapies, minimally invasive surgical techniques and treatments identified through the tools of precision medicine.
Cancer treatment options